Held at: | Private collection |
Reference: | RS/ODP |
Source: | Guest contribution |
Title: | Olchon Development Project: Draft Environmental Audit report |
Place name: | Longtown |
Date: | 1999 |
Description:
Introductory Note:
The bulk of the paper below is an unpublished Draft report prepared as part of a comprehensive Environmental Audit of the Longtown area conducted under the auspices of the Olchon Development Project in 1998/99. In the event ELSG understands that a summary report was submitted and the full Environmental Audit report was never finalised. Part 1 of the full report draft below appears close to a final form, although some of the figures and appendices are missing. We have also assembled at the end ‘Supplementary Material’ from individual figures and subsections found in files relating to the wider studies carried out at the time. We have included this without attempting any of the interpretation or elaboration that no doubt would have been the original intention of the author; some of it may belong in Part 1 of the report, while other elements may have been prepared for inclusion in the intended Part 2. Readers should bear in mind the draft status of this paper and exercise appropriate caution in its use. We are indebted to David Lovelace for making this important material available for our website.
Ewyas Lacy Study Group
The Olchon Development Project
Environmental Audit
Part 1 [Draft]: Landscape History, Grassland and Farming
Introduction
The environmental qualities of the countryside of Longtown Group Parish are considerable and many layered, reflecting the toil of generations of livestock farmers, the deep history of this border area and its place as a transition zone between different geographies and traditions. With major changes in the economy of rural areas on their way, the Parish’s countryside could become its key capital asset. Managing a complex landscape to fulfil different and sometimes opposing objectives on an annual basis depends entirely upon those who live and work there and have the accumulated skill and knowledge. This review of those assets and the farming upon which they are based is primarily to be used by the community for the benefit of everyone in the area as well as those from outside. Conserving and enhancing one of England’s finest jewels of the countryside is a job for its farmers and land owners. With the right rural development tools and the technical information at their disposal they can get on with the job. Without them, countryside 5000 years in the making is at risk.
Meeting the Olchon Development Project targets
1. To review the agricultural and land use data for the area.
The project has obtained the data from the June Census agricultural returns for the four parishes for the years 1968, 1968, 1974, 1980, 1986. Parish level data became unavailable after 1988 but the Farming and Rural Conservation Agency (FRCA) at Crewe were kindly able to provide the census data for the four parishes combined for years 1995, 1996 and 1997. They also provided us with the amounts of subsidy received in each parish from each of the Common Agricultural Policy (CAP) schemes for the years 1992 – 1998. FRCA Worcester provided us with data on the Countryside Stewardship scheme expenditure.
2. Acquire appropriate IT and GIS functionality.
Although this technology is the best way to deal with land use and environmental data, the time, resources and the steep learning curve required to use it would have taken up too much of the project. However valuable experience has been gained using manual mapping, and the database used for the environmental survey data puts us in a good position to make best use of this technology in the future.
3. Acquire sets of aerial photographs of the area.
The project has obtained copies of 1985 and 1995 colour air photographs of the area as well as some black and white larger scale air photos. These have been most useful for survey and display purposes as well as for agri-environment and woodland scheme applications.
4. Conduct landscape and habitat surveys.
Detailed surveys of grasslands, woodlands, hedgerows and ponds have been carried out. The historical underpinning of the landscape has been reviewed in co-operation with the local history group.
5. Hold 5 demonstration days on survey, environmental appraisal and grant schemes.
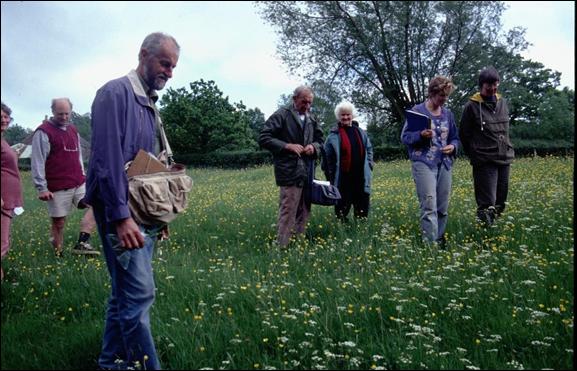
Three evening and two day events were held for the group parish with officers from the county FWAG, the Forestry Authority private woodlands officer and the representatives of the Marches Woodland Initiative. County experts on botany and entomology have conducted a series of 8 field days through May and June training local people in survey and identification skills.
6. Generate 5 Countryside Stewardship Scheme and 3 Woodland Grants schemes.
Five Countryside Stewardship schemes have been applied for this year as a result of the project. Two woodland schemes applications have also been submitted. Both the latter schemes involved the conversion of some forage area to woodland management, which results in loss of income even with Livestock Exclusion Annual Premium (LEAP). As most woodland in the area is used as forage, there is little incentive to convert to woodland management.
7. Produce an illustrated report on audit findings and include a local Biodiversity Action Plan.
Turning the enormous amount of data collected from the field into a user friendly and meaningful form has proved a very time consuming exercise. This report is thus part I – concentrating on grassland, farming, the history of the landscape, and data sources. Part II will feature Woodlands, hedgerows, butterflies and moths, birds and water features. When complete, the audits will allow a full review of the species and habitats of the area, which when combined with other groups and agencies working at the county level, will enable a Biodiversity Action Plan for the area to be produced.
Acknowledgements
The environment section is most grateful to all the farmers and landowners who allowed their land to be studied, given their time to help and discuss farming and conservation issues and without whom any environmental assessment of the area would be impossible. Thanks also to all those who came to the evening meetings and field outings and especially to the volunteers who gave their time to survey and record the variety of habitats in the parishes. The MAFF offices at Crewe and Worcester as well as the officers of the Farming and Rural Conservation Agency have been most helpful in supplying awkward subsets of agricultural and agri-environment data. The Herefordshire Nature Trust and English Nature have given valuable advice and allowed us access to their records for the area.
Finally thanks to the Herefordshire Hills LEADER team who encouraged the Olchon Development Group while project developed.
From Ice Age to Agenda 2000 - a brief land use history.
Knowledge of the development of human settlement and farming is essential to the understanding and appreciation of the deeply historical landscape and varied ecology of Longtown Group Parish.
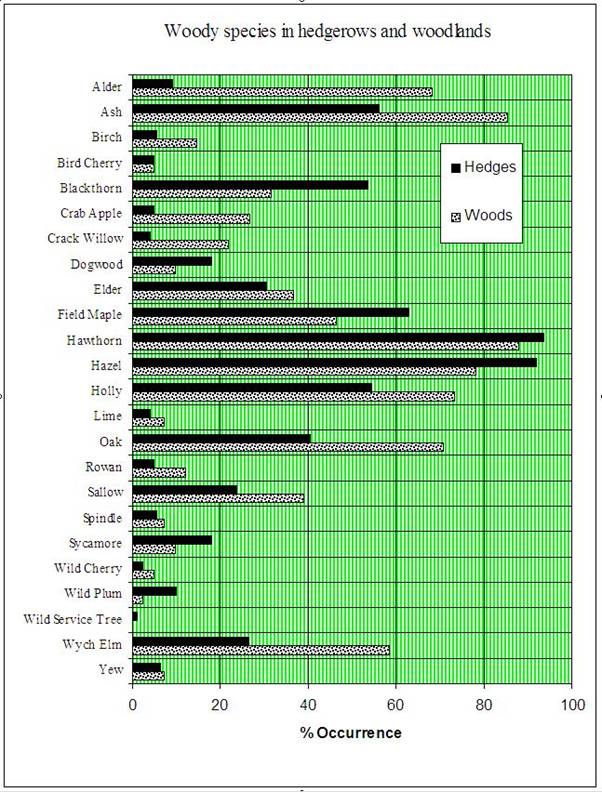
Woodland which colonised and grew to dominate Britain after the last ice-age was generally of similar tree species to that in remaining ancient woodlands today except that the warmer climate of the Atlantic period (5000 – 3000BC) favoured some now rare tree species such as Lime. The living descendants of the local ‘wildwood’ Lime populations can still to be found amongst the dingles and ancient hedgerows throughout the parish (see Figure 2).
|
|
| Figure 2: Tree and shrub species composition of woods (sample of 41) and hedgerows (sample of 121) in Longtown Group Parish. Note the similarity; many hedges may be derived from former woodland |
Human settlement and husbandry was having a marked impact on woodland by the Neolithic period. Analysis and dating of pollen in flood plain sediments of the Severn valley shows the balance of woodland to open country in the catchment had tipped significantly towards clearance by the early Bronze Age and by the mid Iron Age (1000BC) the pollen of trees and shrubs made up only 10% of the total, the remainder being herbage of open ground along with agricultural weeds and crops (Figure 1). [Fig.1 not available] It is likely that the Wye and Monnow valleys had a similar clearance history.
The few archaeological sites from Black Mountains (Craswall, Upper Olchon valley) and surrounding areas (Gannols marsh, Clifford) that have been analysed for pollen and charcoal deposits show evidence of woodland clearance and cultivation in the pre-historic period. Although the resources have not been available for Carbon dating this West Herefordshire work, comparison with the Severn sites above implies that extensive woodland clearance was occurring around the early Bronze Age. Conformation of early human settlement and activity in the area comes from recent finds from the Mesolithic area (pre Neolithic, before 3000BC) at Lower Maescoed (coed=wood), eastern Longtown, of a flint thumb scraper and a ‘microlith’ (a small shaped flint blade). Such artefacts turn up when land is cultivated and are likely to be generally distributed but difficult to find in the predominantly grassland landscape[1] of the group parish.
A review of the environmental evidence for the vegetation and human activity in the upland areas of Herefordshire and Shropshire was published in 1992[2] and some of the background data to that report remains valuable although incomplete.
The four parishes have been part the shifting fortunes of Welsh society in the border regions as the farm, woodland and place names testify. Studies of the early manuscript history of woodlands in Wales[3] point to their importance for a variety of purposes other than just timber or wood. These included the fattening of livestock especially pigs on acorns and nuts, pasture within the wood and tree foliage, berries and nuts (for both livestock and humans) and as a source of honey.
At the time of Domesday, overall woodland cover for England has been estimated at about 15% but for Herefordshire, especially West of the county, the Domesday evidence is oblique. What there is points more to wood pasture than extensive woods with references to the feeding of pigs in woodlands (pannage). Llanveynoe and Craswall are not included in the Herefordshire Domesday but the entry for Longtown reads: “Roger [de Lacy] has an estate called Longtown…From this land Roger has 15 sesters of honey and 15 pigs..” The Crown at the time was probably more concerned with securing the new borders with the Welsh than with raising revenue, but this brief entry is consistent with a wood pasture economy.
A glimpse of the Wales and border landscape comes from Giraldus’s account of his journey through Wales in 1189 which started from Herefordshire. Discussing the early years of Llanthony Abbey and the idealistic aspiration of its monks, he makes reference to the neighbouring valley of “Ewias” [Ewyas] as “situated as they were in the wilderness, they refused to permit the overgrown recesses of the valley, where it widened out into an impenetrable wood, ever to be cleared or levelled off to make an open meadow, for they had no wish to abandon their eremitical [sic] way of life.”
He then paints a lyrical description of an ideal and productive countryside with wood pasture playing a central role:
“Those mountain heights abound in horses and wild game, those woods are richly stocked with pigs, the shady groves with goats, the pasture lands with sheep, the meadows with cattle, farms with ploughs”.
The hills around Llanthony Abbey, just the other side of the Offa’s Dyke ridge from Longtown are clearly not wooded as they are “not of stones and rocks, but rather of soft earth covered with grass”[4]
The upland pastures and farmland of the Ewyas and Olchon valleys as well as lands at Longtown and Walterstone were granted to the monastic houses of Craswall and Llanthony Abbeys throughout the 13th and 14th centuries. If the revenues from the neighbouring Dore Abbey[5] lands are anything to go by then the principal wealth from these lands was derived from wool whose quality from the Golden Valley area was renowned. Florentine merchants were the main buyers of border-produced wool from the early 14th century and in 1303 Dore Abbey was paid £266 8s for their wool. A golden trade indeed.
How much the smaller abbeys of Llanthony and Craswall shared this wealth is uncertain since Dore had its own fulling mills and tanneries and seems to have controlled much of the local trade. Documentation for these abbeys may not have survived or perhaps awaits discovery but it seems likely that Dore’s land management was typical or at least influential. The economic importance of pasture in the area at this time is obvious with Dore Abbey having extensive grants of “pasture in forest and field” and recorded 3,000 sheep in 1291. There were also rights to pasture for “oxen, cows, sheep, pigs, enough to sustain their grange” and also pannage for pigs at Maescoed.
Dore Abbey profited from their timber and wood resources, to such an extent that Giraldus complains that the Dore monks changed “an oak wood into a wheat field”. It is likely that the lands of Craswall and Llanthony also had valuable timber, bark for tanning and wood-pasture. Honey and wax appear in the accounts of a number of Welsh and border monastic houses implying plentiful wild nectar sources in the local wood pasture countryside. In June 1265 Henry III, while staying in Hereford, bought 100lb of wax from the Hereford treasurer, much of which may well have come from the Black Mountains and Golden Valley area.
The productivity of the neighbouring Manor of Brecon which included large areas of upland, including the Black Mountains, is evident even after the ravages of the Black Death since its Welsh tenants provided £1,500 per year revenue for its Marcher Lord, John of Gaunt, in the 1380’s[6] . Owain Glyn Dwr’s revolt 20 years later must have affected the area and there is Welsh evidence of farmland reverting to woodland at this time.
Detailed surveys of land earlier than the 17th century are uncommon but rough estimates were recorded by the King’s officials when land came into the temporary possession of the crown following a dispute or death without clear heirs. An ‘inquisition post mortem’ into lands in Walterstone in 1508 [7] recorded:
“A messuage, 3 carucates[8] of land, 40 acres meadow, 20 acres pasture and 60 acres of wood in Walterston worth 10 marks, held of George Nevyle of Bergevenny, Knight, in socage, as of the honor of Ewyas, to wit, by service of rent of 2s yearly.”
Taken at face value this is approximately equivalent to 170 hectares of which 70% was arable or ley, 15% permanent grassland and 15% woodland.
The period following the dissolution of the monasteries, together with the rise of the main estates - especially that of the Marquis of Abergavenny - and the subsequent development of yeoman farming is now being pieced together by the local history team.
Not until the Tithe surveys of the 1840’s do comprehensive records of land use become available. The history section has extracted this data which is compared with 1997 census returns:
| Land use in Longtown Group Parish | 1840 Tithe survey | 1997 June returns | ||
| Hectares | % | Hectares | % | |
| Arable | 1,607 | 30.2 | 81 | 1.5 |
| Meadow or pasture | 3,561 | 67.0 | 5,164 | 96.8 |
| Woodland | 149 | 2.8 | 88 | 1.7 |
| Total (ex common land and homestead) | 5,317 | 100 | 5,333 | 100 |
The proportion of arable was considerably and surprisingly greater than now, 30% compared with under 2% in 1997. This partly reflected the market upheavals following the Napoleonic wars and tariffs against foreign corn. The woodland and timber resources were under recorded since wood pasture and pasture were not distinguished. Comparison with the 1887 6” OS maps which showed field and hedgerow trees reveals the extent of tree cover and wood pasture. Figure 3 shows apart of Llanveynoe as it appears on the Tithe map, the 1887 OS 6” and a modern air photo. [Fig 3 not available]
Following the trade liberalisation in the mid Victorian period, English agriculture entered a period of depression from the 1870’s, starting with the arable sector, which resulted in many thousands of acres being put down to grass. The livestock sector also suffered including the lowland livestock fattening areas of central Herefordshire. Whereas they could diversify into crops like hops, those in the Longtown area and up the hill would have had to weather the depression as best they could.
The 1890’s depression has strong resonances with the situation facing livestock producers today, so it is worth quoting the agricultural historian P.J. Perry who put the situation of the late Victorian livestock farmer in the depression as follows:
“…capital investment was relatively small; he needed to make relatively few cash payments, his stocks, his feeding stuffs, and even his labour force being primarily home bred. He had few illusions as to his position. In hard times the breeder’s characteristic response was to increase stock if possible, and to accept a lower, sometimes appallingly low, standard of living.”[9]
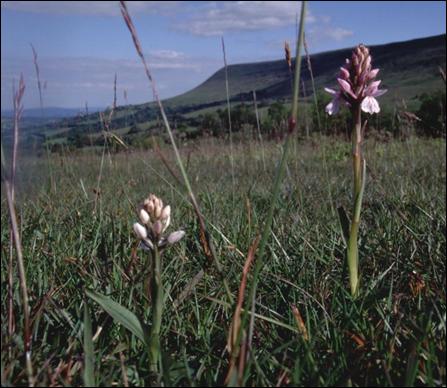
This was the time when the first detailed account of the botany of the county was being written. Some idea of what upland meadows in Herefordshire were like can be obtained from the “A Flora of Herefordshire” published in 1889 by the Reverends Purchas and Ley who described the Green Winged Orchid Orchis morio , a now rare and declining meadow flower of old hay meadows, as ‘common’ and “In hilly pastures it is particularly abundant; and, with the numerous shades of colour which its blossoms present, adds greatly to their ornament”. The magnificent Globe Flower Trollius europaeus only to be found in a very few old un-drained, unimproved grasslands and marshes was evidently not common even then as it was found “Chiefly in the hill districts; rare” but it occurred in the “Craswal valley”, although the Victoria County History of Herefordshire published in 1908 states that “the heads of the Monnow and its tributary brooks support a great abundance of the globe flower”. (Our survey failed to find it, although it is recorded in Craswall fairly recently).
Whatever the effects of the first world war on agriculture in the area, the 1937 Land Utilisation Survey[10] , the next major land use survey after that of the Tithe Acts, showed that for the area of Black Mountains and Golden Valley the land area comprised 75% permanent grassland, 17 % rough grazing, 4% rotational leys and only 4% arable rotational grass and just 4% arable.
By the Second World War the policy of national self-sufficiency and production had become paramount. A grassland survey by the Ministry of Agriculture carried at the start of the war 1939-40 remarked of the “more elevated regions” of Herefordshire that “Much of this land is at present badly infested with rabbits, while ant-hills are a common feature of old pastures. To a large extent the group covers country which, by and large, must be regarded as being in an utterly derelict condition.” Capital was available for war time ‘dig for victory’ campaign and the County War Agricultural Executive Committees (the “war ags”) encouraged compliance with production demands.
The Herefordshire Planning Survey of 1946 remarked of upland grazings in Herefordshire that “They vary in character from heather moorland to Fescue or Agrostis pastures invaded by gorse and bracken, and much of this land was completely derelict in pre-war years”. The survey reflected the idea that grassland improvement was to be an essential component of the rural post-war re-construction policy “Modern machinery and our present greater knowledge of grassland strains makes it feasible to convert much of this land into useful store-raising pastures. It is upon such policy of grassland improvement that the future of western Herefordshire chiefly depends.” [11]
The 1947 Agriculture Act was designed to ensure that farming in post-war Britain received adequate income independent of market conditions while capital grants were available to improve grassland under the 1952 Agricultural Ploughing Grants Act. In essence, ‘dig for victory’ continued to drive agricultural policy and one of its principal targets was the remaining areas of permanent ‘unimproved’ grassland, such that by the 1980’s only 3% of the 1930’s area remained in England[12] .
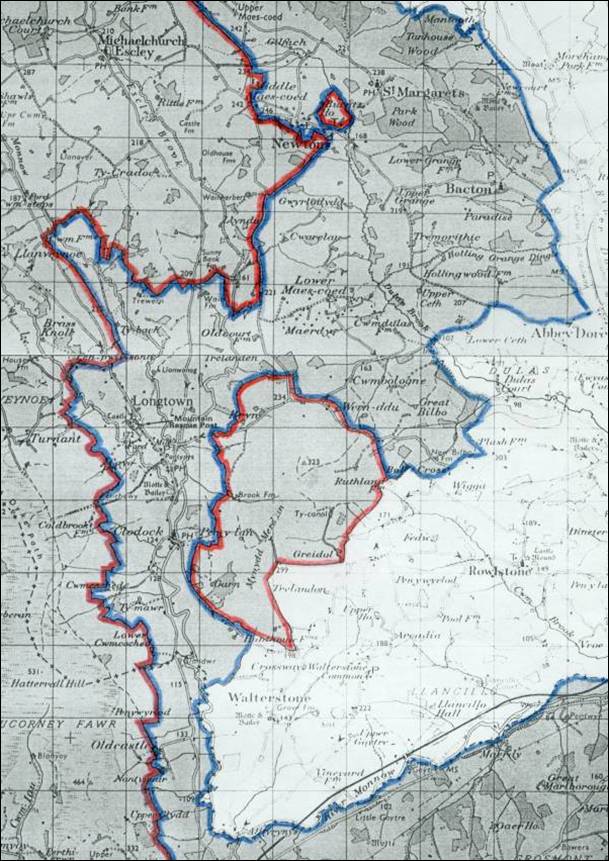
Hill areas like much of the Longtown group parish received special consideration in view of their limited options. Just after the UK’s admission to the European Union, the Less Favoured Area directive increased funds to hill and upland zones in the form of extra headage payments and capital grant aid. All the land above 200m was designated LFA which was all of Craswall, most of Llanveynoe, western edge of Longtown and Mynydd Merddin. In 1984, the FLAs were extended (with lower rates of grant) to included the lower valleys so that now only Walterstone is excluded from the LFA. A map showing the LFA boundaries of the group parish is reproduced in Figure 4.
|
|
Figure 4: Less Favoured Area boundaries covering Longtown group parishThe Red boundary encloses land designated under the original 1975 LFA designation, now known as Severely Disadvantaged Area (SDA). The blue boundary encloses land brought into the LFA in 1984 ‘extended LFA’ now called Disadvantaged Area (DA). Headage rates are less for DA but higher stocking levels are eligible. 1 km x 1 km squares, arbitrary scale
|
A key objective of the EU-wide LFA directive was to stem population decline, conserve the countryside and way of life in mountain areas. In the UK, the resources were used mainly to increase the productivity of livestock farming in upland areas, which involved further pasture improvement, drainage and the reclamation of semi-natural areas. While the directive channelled funds to farm businesses in hill areas, the potential environmental benefits of livestock farming could not be realised economically. The policy tended to favour larger livestock enterprises lower down to hill who could increase production from capital improvement.
The June Returns show the numbers of registered farm holdings declining only slightly compared with the country as a whole. This is due to the increase in registered small holdings reflecting the increasing interest in dwellings with small parcels of land. Farms over 20 Hectares show a sharper decline. Unfortunately, the size breakdown units in the statistics change over the years so that figures for the larger size categories in different years are incompatible.
| Farming Trends in Longtown Group Parish (June Returns) | ||||||
| Number of farms in group parish | 1968 | 1974 | 1980 | 1986 | 1992 | 1997 |
| Under 20 ha | 50 | 42 | 39 | 46 | 57 | 63 |
| Over 20 ha | 97 | 96 | 93 | 88 | 84 | 81 |
| Total recorded holdings | 147 | 138 | 132 | 134 | 141 | 144 |
|
|
|
|
|
|
|
|
| All Cattle | 5,058 | 5,872 | 4,631 | 5,156 | 3,917 | 3,815 |
| Sheep | 44,405 | 49,990 | 55,842 | 67,802 | 63,418 | 64,915 |
Sheep numbers have increased by about 20,000 over thirty years a rate equivalent to an annual increase of 700 per year. Overall cattle have declined by a similar proportion.
Technical developments in livestock farming over the decades have brought efficiency benefits and labour saving but have had knock on effects on wildlife. The change from hay to silage as the principle means of conserving forage and the use of artificial fertilisers have both had the effect of reducing biodiversity in grassland for plants, insects and birds.
In the early 1980’s the first ‘agri-environment’ schemes were on offer to help farmers integrate environmental objectives into their land management. In the UK, Countryside Stewardship is the only such scheme available to farmers outside Environmentally Sensitive Areas and although CS has expanded over the years the grant rates offered remain too low to compete with the headage payments obtained from conventional stocking systems.
An attempt was made in 1990/91 to put the Black Mountains and Golden Valley forward as candidate Environmentally Sensitive Area in the run up to the last round of such designations. Shropshire already had the Clun Upland and Shropshire Hills which between them earns that county about £1.5m a year in environmental management revenue. It was felt that the area had all the conditions for Environmentally Sensitive Area status: high quality landscape, varieties of quality habitats, dependence on farming pattern undergoing changes and it formed a compact geographical unit.
The main impediment was the lack of environmental and farming data to make the case. Although further Environmentally Sensitive Area designations are very unlikely, there are some opportunities for funding environmentally beneficial farming systems under the Agenda 2000 Rural Development Regulations, provided there is the political will to co-fund them and if a case can be made by the potential recipient area.
As of 1998, the public subsidy for managing grassland in Longtown group parish for conservation objectives is about £12,000 a year (~140 hectares at the current rates[13] of £85/hectare) which is just 1.3% of the total headage subsidy for the group parish.
The growing interest in conservation management on farms combined with the scope for building on the considerable environmental assets of the area will be in jeopardy if support is not forthcoming. The alternative of livestock farmers leaving the land would mean a much greater rate of decline of the environmental attributes and an irreversible decline of a complex pastoral landscape.
Apart from the lack of resources there is an in-built conflict between production subsidies and environmental management payments as they are effectively in competition with each other leading to an inefficient use of rural support payments. Currently, there are proposals under the current round of Common Agricultural Policy reform, Agenda 2000, to switch LFA headage payments to area payments. This policy proposal risks depriving small scale upland livestock businesses with enclosed grazing, such as typifies the farming of Longtown group parish, without delivering any environmental benefits. Lack of reform in other parts of the CAP coupled with the currently low allocation of Rural Development and Agri-environment funding can only increase pressure on the local livestock farming.
As this survey shows the group parish retains a wealth of environmental resources, almost all of which require livestock farming in some form to maintain and enhance them. This also requires people with the skills, commitment and the income to manage this unique environment which has been at least 5,000 years in the making.
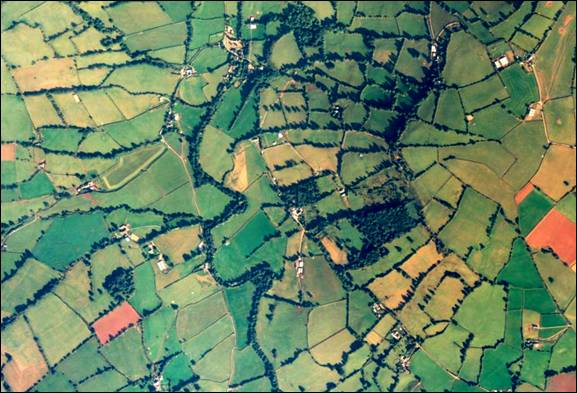
The Monnow valley, southern Longtown . Clodock Church top middle. Mynydd Merddin to the right. NRSC 1998
Grassland
Grazed land occupies 97% of the Group Parish according to the Agricultural Census June Returns so the management of grazed land and methods of conserving forage have a deep impact upon the ecology of the area. Since grassland underpins the farming and rural economy in this livestock based countryside decisions about its management are of key importance to individual farmers both in terms of income and property rights. Any attempt to record, conserve or enhance the environmental aspects of grazed land must be with the consent of the local farming community who are the inheritors and successors to millennia of livestock farming.
Grassland management whether for biodiversity or maximum production is a complex annual cycle with many variables but dependant upon the skill and viability of individual livestock farmers. The unique pastoral landscapes of the Black Mountains area and its grasslands depend ultimately upon the long term health of parish’s livestock farm businesses.
In reviewing existing information about grasslands in the area it became clear that the previous surveys had tended to look from outside at grassland sites as potential nature reserves isolated from their farming, historical and land ownership context. One of these surveys (in 1988) had as its objective to ‘cherry pick’ grassland sites of high conservation value in the county as candidates for statutory controls over their management. Unsurprisingly, that survey and follow up meetings in the area by the statutory agency concerned had a negative impact upon way conservation, especially of biodiverse grassland, was perceived and led to the further loss of some flower rich meadows by owners simply trying to protect their interests.
This project has attempted a different approach by seeking the consent of farmers individually and as a community in advance. The results of this survey are owned by the community through the Olchon Development Project which is answerable to locals. Farm and site level information is held in confidence between the owner and the surveyor and not released without permission. Aggregated data from the all the surveyed sites, minus the site location and name, has been analysed to give an overview of the grassland.
Permission to survey was granted by over 50 farms but with some refusals which are respected. In a few cases, land was entered inadvertently without permission due to misunderstanding or map reading error, mistakes which were acknowledged at the time. Results of each survey have been sent each owner.
While the project has attempted to survey a representative sample of the parish fields, there will be bias towards land of higher conservation value, since the objective of the project required their inclusion and they needed more surveying time. However, a fair number of species rich grassland sites were on farms which were otherwise conventionally farmed so the bias is limited.
Standard pro-formas were created for the project which listed plant species as well as habitat information such as wet areas, anthills etc. Examples of the forms are included at the end this report. Surveyors could record presence or absence or if more time were available abundances as well.
The information, which includes 5360 individual plants records from the field surveys, was entered onto a data base (Excel 97). Only the master data set has information on site location and farm name and a single protected copy is retained by the grassland consultant. For the purposes of the analysis below all locational and personal data were stripped out.
Fields visited were graded 1, 2 or 3 according to their native species composition and overall habitat value. While this is inevitably a subjective judgement, the database of sites can be subsequently analysed so that different kinds of classification and sorting can be performed, including if required that of the National Vegetation Classification (NVC). Grade three is recently improved swards with predominantly Rye Grass and Clovers or occasionally arable and only 20 were surveyed to make a representative sample, as well as additional sites where owners requested surveys. The top grade meadows are the most species rich, had the highest number of ‘key indicator species’ and/or included features such as ant hills or marshy areas. For these meadows management was sympathetic with low stocking rates by conventional standards and very little if any artificial inputs. The middle grade 2 is somewhat arbitrary but includes much of the semi-improved, reverting or species-poor grassland but containing interesting areas within the field boundary. It was quite common to find areas of grassland conservation value within an otherwise improved field, for example in wet flushes, field edges, banks or old quarry workings. These areas were generally inconvenient or uneconomic to manage as intensively as the main part of the field.
The table below shows the amount of land covered by the survey, broken down into its biodiversity grades. Some 398 fields were visited covering 828 hectares or one seventh, 14 %, of the group parish (excluding the mountain common grazing). 254 grassland fields were surveyed in detail, but sometimes a number of fields together were similar and recorded as one site, so the total number of grassland sites was 208. Some 234 species of native grass and herb were recorded including 90 plants which indicate conservation significance (see below).
| Areas in hectares | Grade 3 | Grade 2 | Grade 1 | Total |
| No. of sites surveyed | 38 | 59 | 111 | 208 |
| No. of fields surveyed | 55 | 70 | 129 | 254 |
| No. of fields visited | 199 | 70 | 129 | 398 |
| Area visited | 489 | 188 | 151 | 828 |
| Average field size | 2.5 | 2.7 | 1.2 |
|
| % of group parish (Excluding common land) | 8.4 | 3.2 | 2.6 | 14.2 |
The more species-rich fields tended to be smaller but by no means always and the crude averages hide a considerable range of field size for all conservation grades. Surveyed grassland of the top grade for species richness amounted to 151 hectares or 2.6% of the enclosed parish. Because the surveyors tended to seek out grassland of conservation interest it is difficult to extrapolate this figure to the group parish as a whole. Perhaps double that area of grade 1 grassland remains giving an estimated 300 hectares.
It has been estimated by the UK Biodiversity Action Plan that only some 10,000 hectares of unimproved grassland exists in lowland and enclosed farmland in England. On a pro-rata area basis Longtown’s share should be amount to 6 hectares! While these are very rough figures it is clear that the group parish holds an unusually high proportion of this habitat type.
Talking to farmers it is clear that a number of grasslands which scored well for biodiversity had been ploughed not that long ago. In at least one case natural regeneration from the soil seed bank allowed the farmer to save buying any seed. Some swards which were highly improved and species poor have since recovered much of the presumed original species richness following a numbers of years of management often under the Countryside Stewardship scheme. Grassland sward composition responds to different stocking, mowing and fertiliser regimes while the soil seed bank allows a degree of re-colonisation of ploughed lands. More uncertain is the response of invertebrates, like meadow-specific moth and butterfly species which have to survive the annual cycle of insect stages.
Some species rich grasslands on the deeper soils of the upper valley are becoming taken over by Bracken, a management issue that also affects much of the common management grazing.
Most of the survey work was done between May and August 1999 with a few sites recorded in 1998. The project has drawn up a list of 90 ‘general’ indicator plants species recorded during the survey and which the project considers characteristic of the native unimproved grassland communities of the area and these are listed in appendix 1. [Not available] Relatively few native grasses are present since many are part or have been part of grass seed mixtures. A second list is of 46 ‘key’ indicator plants which have been found during the survey and which are either rare or declining in grassland generally or seem to be associated with the top grade of older biodiverse grasslands in this area. These are listed below together with the numbers of sites out of the sample of 208 where they were found:
| ‘Key’ meadow indicators species Table 1 | |||
| Scientific name | English | No. Sites | % all sites |
| Achillea ptarmica | Sneezewort | 8 | 3.8 |
| Alchemilla sp. | Lady's-mantle | 11 | 5.3 |
| Anagallis minima | Chaffweed | 1 | 0.5 |
| Colchicum autumnale | Meadow Saffron | 2 | 1 |
| Dactylorhiza fuchsii | Common Spotted-orchid | 4 | 1.9 |
| Dactylorhiza sp. | Not identified Orchid | 6 | 2.9 |
| Epipactis helleborine | Broad-leaved Helleborine | 1 | 0.5 |
| Euphrasia sp. | Eyebright | 4 | 1.9 |
| Fragaria vesca | Wild Strawberry | 2 | 1 |
| Genista tinctoria | Dyer's Greenweed | 3 | 1.4 |
| Lathyrus linifolius | Bitter-vetch | 7 | 3.4 |
| Lathyrus pratensis | Meadow Vetchling | 24 | 12 |
| Leontodon hispidus | Rough Hawkbit | 16 | 7.7 |
| Leontodon saxatilis | Lesser Hawkbit | 14 | 6.7 |
| Leucanthemum vulgare | Oxeye Daisy | 13 | 6.3 |
| Listera ovata | Twayblade | 1 | 0.5 |
| Lotus corniculatus | Bird's-foot-trefoil | 69 | 33 |
| Lotus pedunculatus | Large Bird's-foot-trefoil | 58 | 28 |
| Lychnis flos-cuculi | Ragged Robin | 5 | 2.4 |
| Narcissus pseudonarcissus | Wild Daffodil | 2 | 1 |
| Orchis mascula | Early-purple Orchid | 1 | 0.5 |
| ‘Key’ meadow indicators species continued.. | |||
| Scientific name | English | No. Sites | % all sites |
| Pedicularis sylvatica | Lousewort | 5 | 2.4 |
| Pimpinella saxifraga | Burnet-saxifrage | 26 | 13 |
| Pinguicula vulgaris | Butterwort | 1 | 0.5 |
| Platanthera chlorantha | Greater Butterfly-orchid | 1 | 0.5 |
| Polygala serpyllifolia | Heath Milkwort | 1 | 0.5 |
| Polygala vulgaris | Milkwort | 7 | 3.4 |
| Primula veris | Cowslip | 10 | 4.8 |
| Primula vulgaris | Primrose | 1 | 0.5 |
| Ranunculus flammula | Lesser Spearwort | 21 | 10 |
| Rhinanthus minor | Yellow-rattle | 14 | 6.7 |
| Saxifraga granulata | Meadow Saxifrage | 3 | 1.4 |
| Stachys officinalis | Betony | 15 | 7.2 |
| Stellaria uliginosa | Bog Stitchwort | 14 | 6.7 |
| Succisa pratensis | Devil's-bit Scabious | 21 | 10 |
| Thymus | Wild Thyme | 4 | 1.9 |
| Tragopogon pratensis | Goat's-beard | 3 | 1.4 |
| Valeriana dioica | Marsh Valerian | 2 | 1 |
| Veronica officinalis | Heath Speedwell | 27 | 13 |
| Vicia cracca | Tufted Vetch | 4 | 1.9 |
| Viola riv/reich | Dog Violet | 17 | 8.2 |
The Green Winged Orchid Orchis morio was initially recorded late in the season from Walterstone but could not be confirmed.
A fair diversity of Sedge species were recorded:
| Meadow Sedge Species Recorded | |||
| Scientific name | English | No. Sites | % all sites |
| Carex caryophyllea | Spring Sedge | 9 | 4.3 |
| Carex echinata | Star Sedge | 8 | 3.8 |
| Carex flacca | Glaucous Sedge | 27 | 13.0 |
| Carex hirta | Hairy Sedge | 18 | 8.7 |
| Carex nigra | Common Sedge | 10 | 4.8 |
| Carex ovalis | Oval Sedge | 16 | 7.7 |
| Carex pallescens | Pale Sedge | 3 | 1.4 |
| Carex panicea | Carnation Sedge | 12 | 5.8 |
| Carex pilulifera | Pill Sedge | 4 | 1.9 |
| Carex pulicaris | Flea Sedge | 2 | 1.0 |
| Carex remota | Remote Sedge | 1 | 0.5 |
| Carex spicata | Spiked Sedge | 4 | 1.9 |
| Carex sylvatica | Wood-sedge | 1 | 0.5 |
There are two known specialities of the upper valley areas, the Globe Flower Trollius europeaus and Upright Vetch Vicia orobus both now very rare and declining nationally. The survey did not come across either of them, although we hope they are hanging on somewhere.
The distribution of the 208 grassland sites with one or more of these indicators is analysed below (different Sedges species counted as one for the following analysis):

The same figures are shown below as a cumulative distribution of the numbers of
sites with more than a certain number of key species:
From this chart 53 sites were surveyed which had 5 or more of the key indicator species of table 1, and 14 sites had 10 or more key species. Some 61 sites (208 minus 147) had no key species. These figures are displayed in tabular numerical form including percentages in appendix 2. [Not available]
The data can be used to look at, for example, the reasons why different sites have particular combinations of species by querying the database for particular groups of plants. The grassland data set has taken a considerable amount of time pull together but it can now be used to show scientifically the great diversity of grassland that exists in the parish, including areas which have potential for restoring biodiversity. It can also be used to help farmers individually or as a community to make a case for agri-environment resources and making better use of their wildlife assets.
An extract of the data for wet grassland and flush indicators in the enclosed meadows of the Group Parish is below:
| Scientific name | English Name | No. of sites |
| Ajuga reptans | Bugle | 30 |
| Alopecurus geniculatus | Marsh Foxtail | 15 |
| Filipendula ulmaria | Meadowsweet | 16 |
| Galium palustre | Marsh-bedstraw | 21 |
| Isolepis setacea | Bristle Club-rush | 12 |
| Lychnis flos-cuculi | Ragged Robin | 5 |
| Mentha sp. | Mint | 10 |
| Ophioglossum vulgatum | Adder's-tongue | 6 |
| Pinguicula vulgaris | Butterwort | 1 |
| Stellaria uliginosa | Bog Stitchwort | 14 |
| Valeriana dioica | Marsh Valerian | 2 |
Some aspects of grassland management require precise systems of management with low inputs especially for certain meadow invertebrates such as butterflies and moths. (see butterfly and moth section).
The Mountain
The Black Mountains rise to the west above the enclosed farmland of the Olchon and Monnow Valleys and form a spectacular ridge visible from most of Herefordshire before merging beyond the line of Offa’s Dyke into the moorland and valleys of the Brecon Beacons National Park. Above the upper Olchon valley, Craswall’s parish boundary with Wales rises to just over 700 meters, the highest point in Herefordshire from where the ridge runs 14 km SE to Hatterall Hill next to SW Longtown. The spur which tapers to a narrow ridge known at the Cat’s Back divides the Upper Olchon and Upper Monnow valleys.
This tract of steep hill side and common grazing is part of the Black Mountain Site of Special Scientific Interest designated for its upland moorland vegetation and associated habitats and extending westwards into Wales to cover some 7,927 Ha. The Herefordshire part is entirely within Longtown Group Parish and amounts to 1,183 ha or 17% of the area of the Group parish and represents a complex of upland geography and habitats unique to the county.
The mountain itself consists largely of Old Red Sandstone, some 400 million years old, subsequently deeply incised by river valleys following the tilt of the uplift to the SSE. They were further sculpted by the downward flow of ice masses off the mountain during the last ice age exposing overlaying horizontal strata of more resistant rocks forming a complex landscape of great geological interest. In the upper part of the Olchon Valley are outcrops of Limestone and caps of harder Quartzite conglomerate rock, while along the ridge above Longtown the Red and Black Darrens are well known outcrops of shaley Red Sandstone.
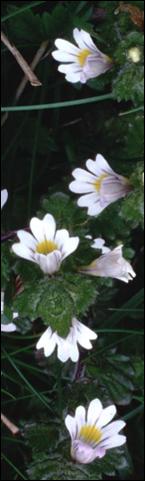
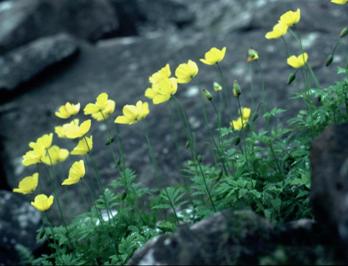
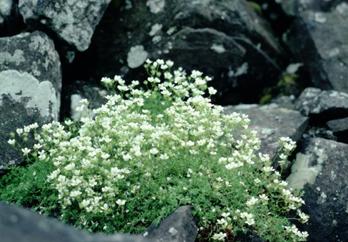
This is the only area of true upland habitat in Herefordshire varying from acid peaty moorland on the top with Heather and Bilberry, to the Limestone outcrops, mountain streams and springs of the steeper slopes where the insectivorous Butterwort, rare Brittle Bladder Fern, Limestone Polypody, Welsh Poppy and Mossy Saxifrage grow. The deep valleys and proximity of the enclosed farmland makes this landscape one of quickly varying transition from mountain to valley bottom. A number of bird and insect species characteristic of mountains are at the edge of the geographical distribution.
Enclosed meadows which abut the moorland are sometimes unimproved former haymeadows which still retain a variety of indicator plants such as Eyebright, Tormentil and Autumn Crocus. The Black Mountains SSSI boundary includes some of them.
The project did not survey the mountain for its vegetation as this has been the subject of a number of studies already, but some moth surveys were carried out and the mountain is included in the forthcoming BTO bird survey of the Black Mountains and Golden Valley which has relied on the Olchon Development Project for local knowledge.
Data on Farming and Environment in the Group Parish.
Tithe Surveys
The first comprehensive land use survey of the Group Parish was undertaken following the Tithe Commutation Act of 1836 which commuted church taxes levied in each Parish from an in-kind payment into a standardised monetary rate per area of land. To calculate the tithe dues of each parish, surveys were commissioned into land use, area, ownership and tenancy of every piece of eligible land in each parish of the land. It was in effect the first national land use survey since Domesday, mapping and listing land parcels to the smallest unit of land measure a ‘pole’ (0.23 % of a hectare). The maps and their ‘apportionments’ for Craswall, Llanveynoe, Longtown, and Walterstone, (surveyed 1840-43, 1840-41, 1840-41 and 1839-41 respectively) are held by the Hereford Records Office and are an important source of information about local history and land use. Farmed land in the group parish was classified as ‘arable’, ‘meadow’, ‘pasture’ or ‘rough pasture’, while woodland was ‘wood’, ‘brake’, ‘orls’ or ‘plantation’.
The name of a field or wood can often indicate its earlier history or present character and this is one of the important facts recorded in most Tithe surveys, but for this parish group only Walterstone has a good coverage of field and wood names with only a scattering of names in the other parishes.
The local history society has conducted a major review of the Tithe survey data - see the Local History Report (2) Field Name Survey.
There is also a wealth of farm, estate or manorial documents, often in private hands or awaiting discovery in libraries and records offices which can shed light on many aspects of the parish farming, land use and the way of life which is the subject of much original research by the History Group.
6” Inch to the Mile Ordnance Survey Maps
These were published in 1887 and introduced, for the first and only time in British cartography, symbols for individual trees as well as for coppice, plantation, rough pasture, scrub and ponds. The maps show the extent of unimproved rough pasture and give a good idea of the real tree cover of the area in the early 1880’s (the survey took many years to compile). They also demonstrate that much of what was described as ‘rough pasture’ or even just ‘pasture’ by the Tithe maps and surveys of 1840 were grazed woodland or wood-pasture. The 6” map clearly delineates wooded dingles, wood-pasture, parkland and hedgerows trees all contributing to a richly treed pastoral countryside whose trees were unlikely to have all sprung up in the 40 years from 1840. Although the agricultural depression started in the cereal sector in the 1870s, livestock prices were holding their own or increasing up to the 1880s when the OS maps were surveyed, so is it unlikely that grazing density on pasture would have reduced, if at all, in the 40 years following the Tithe survey.
The only plantations which appear on the 6” map are the same two which are mapped by the Tithe survey and one of those has been reduced to a scatter of conifer symbols. The tree symbols on the 6” map almost certainly indicate trees which were growing at the time of the Tithe survey and probably underestimate Tithe survey tree cover, since the trend throughout the mid Victorian period for Herefordshire as a whole was to fell farmland trees and the convert woodland to agriculture.
To see how a sample tract of the parish countryside is shown as it appears in on the c1840 Tithe map, the 1887 6” OS map and the 1995 aerial photographic survey of Herefordshire see figure 3. [Not available]
National Farm Survey 1940-1943
Recently (1993) released into the public domain under the 50 year rule this wartime survey details each individual holding over five acres, consisting, in addition to the usual June census data, information such as conditions on the farm, availability of electricity, how the farm is managed, which fields are to be ploughed for the war effort etc., as well as an annotated map of each farm. This data is merely noted as existing but has not been looked at. It is likely to be important as a very detailed assessment of the state of agriculture and land use as well as of great interest to local historians and farmers. The PRO reference numbers are MAF/32 for the survey forms and MAF/73 for the maps.
Herefordshire Planning Survey 1946 was part of the post war reconstruction planning process co-ordinated at a West Midland region. It contains an interesting overview of the county at the time. The sections on livestock and grassland have been quoted in the grassland section here.
Parish Summaries of the June Returns
The main source of agricultural statistics for more than a century has been the annual records of cropping, grassland, livestock and later labour which farm holdings have had to give to MAFF each summer for the compilation of parish, county and national agricultural statistics. The series starts in 1866 when the ‘returns’ were voluntary and produced figures of limited accuracy but from 1917 farmers have had to supply the information by statute. The data was aggregated for each parish and originals destroyed.
These ‘parish summaries’ are a valuable source of statistical data on local farming patterns and land use trends although the types of questions asked on the census forms have changed over the years making time series analysis tricky to interpret. Another source of inaccuracy is that holdings may farm land in adjacent parishes or further away. A serious problem occurred with this national data source in 1988 when it was decided that some farm sizes were becoming so large compared with some parishes that publication could threaten confidentiality. Data in adjacent parishes were aggregated into ‘agricultural parish groups’, typically 4 or 5 parishes for this area which often straddle dissimilar farming areas, but from 1989 data from these groups has been the smallest geographic area available. Further difficulties arise since for the first time figures for the numbers of holdings and the workforce were rounded to the nearest multiple of 5 making socio-economic analysis at group parish level difficult and comparisons with earlier years impossible.
The Olchon project group parish is split between two much larger parish groups so the available figures were meaningless for this project. The project has obtained the individual returns for each of the four parishes for years 1968, 1974, 1980 and 1988 and these combined with the FRCA Longtown group data are presented overleaf:
| Farming Trends in Longtown Group Parish | ||||||
| Number of farms in group parish | 1968 | 1974 | 1980 | 1986 | 1992 | 1997 |
| Under 20 ha | 50 | 42 | 39 | 46 | 57 | 63 |
| Over 20 ha | 97 | 96 | 93 | 88 | 84 | 81 |
| Over 50 ha | n/a | n/a | n/a | n/a | 32 | 31 |
| Total recorded holdings | 147 | 138 | 132 | 134 | 141 | 144 |
| Time series analysis is made complex for employment and farm numbers since MAFF's definitions change through the years. Data for 1974 -1986 is more comprehensive than that for 1990-1997, which are summaries of core data, but are incompatible. For example, spouses of farmers, partners and directors are not disaggregated for >1990 data. Employment data collected for June returns prior to 1988 is incompatible with later returns. The June returns record "part time" and "casual" employment. These are taken as 1/2 and 1/6 of a full time job or "FTE" = Full Time Equivalent job. Agricultural support to the group parish expressed as average £/job and £/farm. The latter for farms over 20 ha (occupying 88% farmland) and over 50 Ha (occupying 58%) farmland. | On-farm employment | |||||
| Full time | 166 | 173 | ||||
| Part time | 68 | 65 | ||||
| Casual | 25 | 23 | ||||
| FTE | 204 | 209 | ||||
| Agricultural support per job and per farm (see below) | ||||||
| Average £/FTE
| £4,601 | |||||
| Average £/Farm >20 ha | £10,498 | |||||
| Average £/Farm >50ha | £17,920 | |||||
| Livestock | ||||||
| Numbers of animals | 1968 | 1974 | 1980 | 1986 | 1992 | 1997 |
| Beef Cattle | 4,784 | 5,493 | 4,285 | 4,815 | 3,595 | 3,474 |
| Dairy Cattle | 274 | 379 | 346 | 341 | 322 | 341 |
| All Cattle | 5,058 | 5,872 | 4,631 | 5,156 | 3,917 | 3,815 |
| Sheep | 44,405 | 49,990 | 55,842 | 67,802 | 63,418 | 64,915 |
Augmenting the June Return data the project obtained details of the annual subsidies for each parish from the years 1993 to 1997 in respect of all direct support schemes administered by MAFF. This has been useful for analysing the sensitivity of the area’s farming to changes in European and national agricultural policy especially with the Agenda 2000 reforms and the future impacts of the WTO negotiations over the next few years. These figures have been used to inform the Rural Business Needs section.
See overleaf:
| Farm subsidies in Longtown Group Parish | |||||||
| Farm subsidy by Scheme 1997 Data from MAFF June returns and FRCA Worcester. | |||||||
| Scheme | Craswall | Llanveynoe | Longtown | Walterstone | Group parish total | % Total support | |
| Suckler Cow Premium | £43,023 | £20,068 | £40,500 | £5,715 | £109,306 | 11.3 | |
| Extensification premium | £11,907 | £3,021 | £12,187 | £585 | £27,700 | 2.9 | |
| HLCA | £90,005 | £39,072 | £59,578 | £4,403 | £193,058 | 20.0 | |
| Sheep Annual Premium | £149,401 | £50,714 | £129,322 | £16,287 | £345,724 | 35.9 | |
| Sheep Annual Premium LFA supp. | £66,291 | £22,502 | £53,927 | £4,383 | £147,103 | 15.3 | |
| Beef Special Premium Scheme | £17,661 | £4,055 | £31,759 | £6,422 | £59,897 | 6.2 | |
| Arable Area Payment (1998 figure) | n/a (1) | n/a | n/a | n/a | £9,931 | 1.0 | |
| Dairy (2) | n/a | n/a | n/a | n/a | £27,730 | 2.9 | |
| Countryside Stewardship Scheme Capital payment (3) | £30,538 | 3.2 | |||||
| Countryside Stewardship Scheme Revenue payment (3) | £12,238 | 1.3 | |||||
| Total agricultural support (4) | £378,288 | £139,432 | £327,273 | £37,795 | £963,225 | 100.0 | |
| non LFA | £221,992 | £77,858 | £213,768 | £29,009 | £623,064 | 64.7 | |
| LFA | £156,296 | £61,574 | £113,505 | £8,786 | £340,161 | 35.3 | |
| % LFA of Total | 41.3 | 44.2 | 34.7 | 23.2 | 35.3 |
| |
| Total headage |
|
|
|
| £882,788 |
| |
| Total headage as % total support |
|
|
|
| 91.6 |
| |
| CSS total |
|
|
|
| £42,776 |
| |
| CSS total as % total support |
|
|
|
| 4.4 |
| |
| Longtown Group Parish Area, Hectares | 2,096 | 1,865 | 2,533 | 508 | 7,002 |
| |
| Average CAP support per Hectare |
|
|
|
| £137.56 |
| |
| Farm support in Herefordshire (1997) | |||||||
| Total agricultural support (excluding BSE compensation) | £31,858,552 |
| |||||
| County Area , Hectares | 216,000 |
| |||||
| Average CAP support per Hectare | £147.49 |
| |||||
Notes:
(1) Information by parish not available
(2) Dairy sector is indirectly supported through export refunds, storage & intervention. This estimate of £9,931 is derived by dividing UK dairy support (£210m 1997/98) by the total dairy herd (2,587,000 =£81.32 per dairy cow) and multiplying by parish group dairy herd (341).
(3) CCS expenditure is estimated by annualising the available 1998 figures for 10 year scheme commitments (from FRCA Worcester).
(4) Excludes BSE compensation to farms, which can be estimated as follows: In 1997 £446m were paid out under the OTMS & CPAS schemes, which was equivalent to £38.46 per head of the total UK cattle population (11,609,000). If the Longtown group parish was typical of the national average, BSE compensation of £146,725 obtained by multiplying £38.46 by the recorded total cattle (3,815). This brings the total cost of public farm support in Longtown Group Parish to £1,109,950.
Aerial Photographs
The 1946 - 1950’s RAF set of aerial photographs is fairly complete and includes quite a lot of low level coverage. The Ordnance Survey has a large Black and White aerial photography of the county including the group parish.
Colour photography of the four parishes is available from the Brecon Beacon National Parks flights taken in 1983 and the National Remote Sensing Centre has flown Herefordshire in colour in 1995. These recent air photographs have been acquired by the project for the environmental assessment.
Other data includes :
The 1976 Habitat Survey of Herefordshire; Herefordshire Ancient Woodland Inventory 1986; Three Counties Meadow Survey 1988; Hereford & Worcester Wildlife Site Register 1992; Black Mountains SSSI Survey 1970s to1990s.
There are a number policy papers from English Nature and Countryside Agency which cover the Black Mountains and Golden Valley area, but these are fairly broad in scope and reliant on old data.
There is at present an on-going process of Biodiversity Action Plans, Habitat Action Plans and Species Action Plans being formulated in partnership with the main agencies and voluntary groups.
The Olchon Development Project
Environmental Audit
Supplementary Material & Footnotes
Meadow Plants
|
|
| One of 5 environmental training and recording days carried out during the course of the project |
|
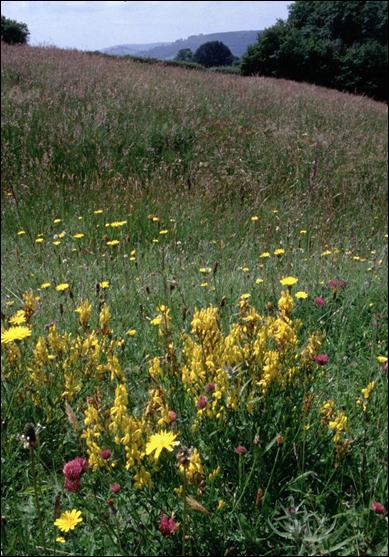
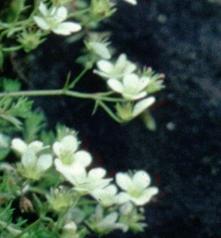
| Dyer’s Greenweed Genista tinctoria growing in one of the few remaining old meadows in where it thrives (This is from Walterstone). Formerly quite common, pasture improvements, fertilisers and high stocking levels have resulted in this plant and many other native meadows plants declining sharply in recent years. Longtown group parish may have more species rich grassland than most parts of the county.
|
|
|
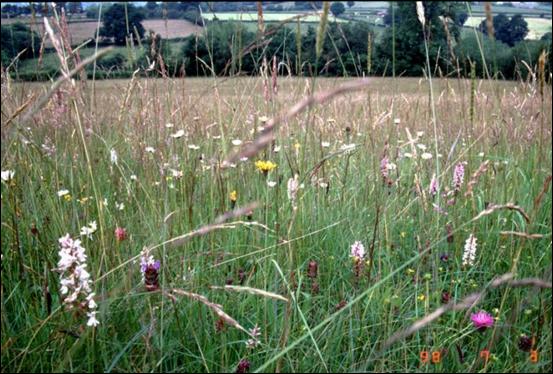
| Traditional hay meadow in Walterstone. Common Spotted orchid, Knapweed and variety of grasses. Such meadows are now nationally rare and declining. Their management is difficult and depends upon committed livestock farmers.
|
|
| Spotted Orchids growing in one of a number of surviving unimproved wet meadows in the upper reaches of the Monnow near the watershed with Wye. Northern Craswall.
|
|
| Eyebright from one of the enclosed meadows near the Cat’s Back. |
The Mountains
|
|
|
|

|
| Welsh Poppy , rare among rocks above the Darren |
|
| Mossy saxifrage , a rare plant of upland scree on the Mountain in Craswall |
|
|
Woodlands and Hedgerows
|
|
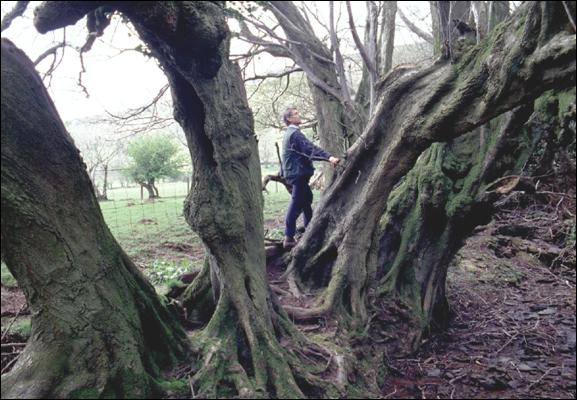
| The oldest living entity in Herefordshire? A massive 9 meter wide Lime tree with seven stems. Straddling a boundary between farms, above Clodock Church this would have been ancient at the time of Domesday. Lime was abundant during the warm Neolithic area since when they have become rare as they do not naturally regenerate from seed in the wild. Surviving native Limes in woods and hedgerows of West Herefordshire are likely to be direct descendants of the original wild wood Lime population.
|
|
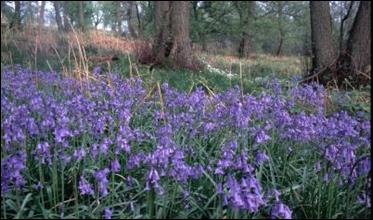
| An Alder coppice, Ash and Oak Bluebell wood in Longtown . The survey has recorded many plants characteristic of the ground flora of old woodland but the proportion of woodlands with diverse flora is small mainly because of grazing levels. Most woodland will recover if fenced from stock.
|
|
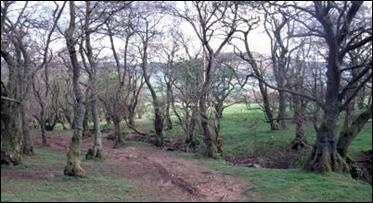
| Heavily grazed Alder woodland, Llanvenoe . Although wood pasture systems have been feature of the area for many hundreds of years, current stocking levels in woodland are preventing regeneration and damaging the ground flora. Incentives for removing or reducing stocking in woods cannot compete with headage payments. |
|
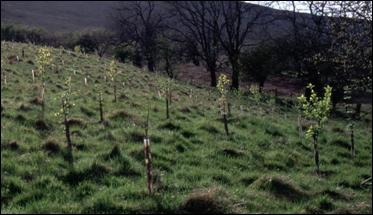
| New native tree planting on pasture, Llanvenoe . There are only a small number of farmland planting schemes in the area at present. Native woodland will also naturally colonise open ground if left.
|
Butterflies and Moths
|
|
| Studying grassland insects in meadows. |

|
|
|
|
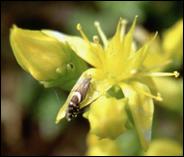
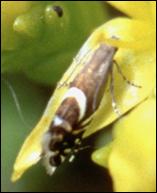
|
|
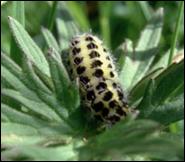
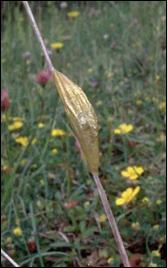
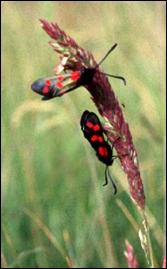
| The day flying Six Spot Burnet Moth larva, pupa and adults . Depend on unimproved and species rich grassland for their survival. Glyphipterix equitella is one of over a thousand species of micro-moth, some having specialised habitat requirements. This one lives its life cycle on Sedum on walls and roofs. Very rare, Craswall is almost the only known county site. These photographs are from Dukes Farm, Craswall.
|
|
|
|
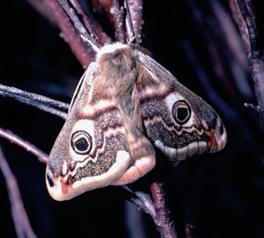
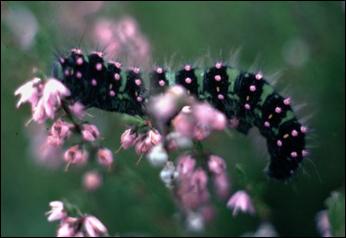
| The Emperor Moth and larva, only found on Heather moorland, seen in western Craswall. | |
|
|
| The Twin Spot Carpet moth , common but characteristic of heather moorland |

[1] The project is indebted to Clare Wychbold of Lower Maescoed for this information as well as for giving the project access to original data from her involvement with the Craswall archaeological site.
[2] The Marches Uplands: an assessment of the palaeoenvironmental evidence. 1992. Clare de Rouffignac. Marches Upland Survey. Hereford and Worcester County Archaeological Service.
[3] Welsh Woods and Forests: History and Utilisation by William Linnard. 1982 National Museum of Wales.
[4] The Journey through Wales and Description of Wales by Gerald of Wales. Translation by Lewis Thorpe. Penguin 1978.
[5] Economic history of Dore Abbey: White Monks in Gwent and Borders by Rev. David H. Williams. 1976. Griffin Press, Pontypool.
[6] The Revolt of Owain Glyn Dwr by R.R. Davies OUP 1995
[7] Calendar of Inquiry Henry VII HMSO 1955.
[8] As much land as could be ploughed by an oxen team in one year. Equivalent to a ‘hide’ and very roughly 100 acres.
[9] British farming in the Great depression 1870 – 1914 by P.J. Perry 1974. Quoted from Agricultural Depression 1870 to 1900 by G. M. Robinson Transaction of the Woolhope Naturalists’ Filed Club Volume XLII 1978.
[10] The Land of Britain. The Report of the Land Utilisation Survey of Britain 1938 by T. Stuart-Menteith. Detailed Maps were produced and the original are held at University College Library, London, Copies are difficult to obtain.
[11] The West Midland Group on Post-War Reconstruction and Planning. A Planning Survey of Herefordshire. Faber and Faber 1946
[12] Fuller, R., 1987 Loss of unimproved Grassland in Britain since the 1930’s HMSO.
[13] As of 1999 MAFF have introduced an upland hay meadow option in CS which pays £150 per hectare. This is conditional upon a whole farm survey. The regional budgets for this option are likely to be very restricted.
Ref: rs_lon_0273